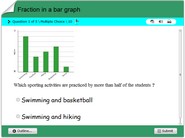
Fraction in a bar graph quiz
Test your fraction knowledge with this fraction in a bar graph quiz exercise.
Bar graphs and fractions math quiz online for children
Bar graphs and fractions math quiz online for children to review. Representing data on bar graphs some times warrants that children to understand the notion of fractions. This free math online test contains a number of math problems containing a bar graph from which children have to estimate what fraction of the data represents a particular entity as required by each question. This is a multiple choice questions test and children have the flexibility to make several attempts. By doing this activity repetitively, the notion representing data visually as well as data interpretation will be passed along. This quiz will work for children in 3rd, 4th, 5th, 6th and 7th grades.
A bar graph is a visual representation of data, using bars of different lengths to show the quantities or proportions of the data. Fractions can be used on a bar graph to show the part of a whole that each data point represents.
To create a bar graph using fractions, first decide on the data you want to represent. For example, you might want to show the fraction of each type of fruit in a basket of mixed fruit. In this case, you would have one bar for each type of fruit.
Next, decide on a scale for the bar graph. This will depend on the size of the fractions you are working with and the space available on the graph. For example, if you are working with fractions that are all less than 1/2, you might choose a scale of 1/2, 1/4, 1/8, etc. On the other hand, if you are working with larger fractions, you might need to use a larger scale.
Once you have determined the scale for the graph, you can start creating the bars. To create a bar for a fraction, you will need to decide on the length of the bar and the starting point. The length of the bar should be proportional to the size of the fraction, using the scale you have chosen. For example, if the fraction is 1/4 and the scale is 1/4, the bar should be as long as one of the divisions on the scale. If the fraction is 1/2 and the scale is 1/4, the bar should be twice as long as one of the divisions on the scale.
The starting point for the bar will depend on the fractions that came before it. For example, if the fraction is 1/4 and the previous fraction was 1/4, the bar for the new fraction should start at the end of the previous bar. If the previous fraction was 1/2, the bar for the new fraction should start halfway between the end of the previous bar and the beginning of the next division on the scale.
When creating a bar graph with fractions, it’s important to label both the scale and the bars. The scale should be labeled with the fractions that correspond to each division, while the bars should be labeled with the data they represent. For example, in the fruit basket example, the bars might be labeled “apples,” “oranges,” “bananas,” etc., while the scale might be labeled with fractions such as 1/4, 1/2, 3/4, etc.
It’s also important to include a key or legend on the bar graph to explain what each bar represents. This can be especially useful if the data points are represented by different colors or patterns on the graph.
In addition to showing the data as fractions, you can also use a bar graph to compare fractions. For example, you might want to compare the fractions of different types of fruit in two different baskets of mixed fruit. To do this, you can create two bar graphs side by side, with one graph for each basket. You can then compare the lengths of the bars on each graph to see which basket has more of a particular type of fruit.
Bar graphs are a useful tool for visualizing and comparing data, and using fractions on a bar graph can help you better understand the proportions of the data. Whether you are working with fractions that represent parts of a whole or fractions that are being compared to each other, a bar graph can be a helpful tool for understanding and interpreting the data.